West Bank :: Middle East
Introduction
Background:
Inhabited since at least the 15th century B.C., the West Bank has been dominated by many different peoples throughout its history; it was incorporated into the Ottoman Empire in the early 16th century. The West Bank fell to British forces during World War I, becoming part of the British Mandate of Palestine. Following the 1948 Arab-Israeli War, the West Bank was captured by Transjordan (later renamed Jordan), which annexed the West Bank in 1950; it was captured by Israel in the Six-Day War in 1967. Under a series of agreements known as the Oslo accords signed between 1993 and 1999, Israel transferred to the newly created Palestinian Authority (PA) security and civilian responsibility for many Palestinian-populated areas of the West Bank as well as the Gaza Strip. In 2000, a violent intifada or uprising began, and in 2001 negotiations to determine the permanent status of the West Bank and Gaza Strip stalled. Subsequent attempts to re-start direct negotiations have not resulted in progress toward determining final status of the area. ++
Roughly 60% of the West Bank, remains under Israeli civil and military control. In early 2006, the Islamic Resistance Movement (HAMAS) won a majority in the Palestinian Legislative Council (PLC) election. Attempts to form a unity government between Fatah, the dominant Palestinian political faction in the West Bank, and HAMAS failed, leading to violent clashed between their respective supporters and HAMAS's violent siezure of all military and governmental institutions in the Gaza Strip in June 2007. Since 2007, the PA has administered parts of the West Bank under its control, mainly the major Palestinian population centers and areas immediately surrounding them. Fatah and HAMAS have made several attempts at reconciliation, but the factions have been unable to implement agreements including the latest agreement signed in October 2017. In December 2018, the Palestinian Constitutional Court dissolved the PLC. In 2019, PA President ABBAS renewed his calls for PLC elections.
Geography
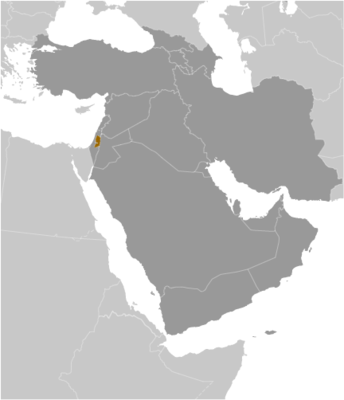
Location:
Middle East, west of Jordan, east of Israel
Geographic coordinates:
32 00 N, 35 15 E
Map references:
Middle East
Area:
total:
5,860 sq km
land:
5,640 sq km
water:
220 sq km
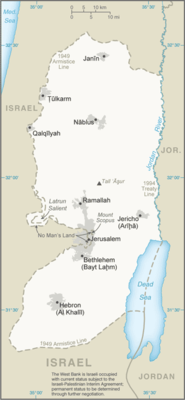
note: includes West Bank, Latrun Salient, and the northwest quarter of the Dead Sea, but excludes Mt. Scopus; East Jerusalem and Jerusalem No Man's Land are also included only as a means of depicting the entire area occupied by Israel in 1967
country comparison to the world: 171
Area - comparative:
slightly smaller than Delaware
Land boundaries:
total:
478 km
border countries (2):
Israel 330 km, Jordan 148 km
Coastline:
0 km
(landlocked)
Maritime claims:
none (landlocked)
Climate:
temperate; temperature and precipitation vary with altitude, warm to hot summers, cool to mild winters
Terrain:
mostly rugged, dissected upland in west, flat plains descending to Jordan River Valley to the east
Elevation:
lowest point:
Dead Sea -431 m
highest point:
Khallat al Batrakh 1,020 m
Natural resources:
arable land
Land use:
agricultural land:
43.3%
(2011 est.)
arable land:
7.4%
(2011 est.)
/
permanent crops:
11%
(2011 est.)
/
permanent pasture:
24.9%
(2011 est.)
forest:
1.5%
(2011 est.)
other:
55.2%
(2011 est.)
note: includes Gaza Strip
Irrigated land:
240 sq km; note - includes Gaza Strip
(2012)
Population distribution:
Palestinian settlements are primarily located in the central to western half of the territory; Jewish settlements are found in pockets throughout, particularly in the northeast, north-central, and around Jerusalem
Natural hazards:
droughts
Environment - current issues:
adequacy of freshwater supply; sewage treatment
Geography - note:
landlocked; highlands are main recharge area for Israel's coastal aquifers; there are about 380 Israeli civilian sites, including about 213 settlements and 132 small outpost communities in the West Bank and 35 sites in East Jerusalem
(2017)
People and Society
Population:
2,900,034
(July 2020 est.)
note: approximately 418,600 Israeli settlers live in the West Bank (2018); approximately 215,900 Israeli settlers live in East Jerusalem (2014)
country comparison to the world: 139
Nationality:
noun:
NA
adjective:
NA
Ethnic groups:
Palestinian Arab, Jewish, other
Languages:
Arabic, Hebrew (spoken by Israeli settlers and many Palestinians), English (widely understood)
Religions:
Muslim 80-85% (predominantly Sunni), Jewish 12-14%, Christian 1-2.5% (mainly Greek Orthodox), other, unaffiliated, unspecified <1%
(2012 est.)
Age structure:
0-14 years:
35.31%
(male 525,645/female 498,458)
15-24 years:
20.75%
(male 307,420/female 294,469)
25-54 years:
35.19%
(male 516,758/female 503,626)
55-64 years:
5.12%
(male 76,615/female 72,006)
65 years and over:
3.62%
(male 48,387/female 56,650)
(2020 est.)
Dependency ratios:
total dependency ratio:
71.2
youth dependency ratio:
65.7
elderly dependency ratio:
5.5
potential support ratio:
18.2
(2020 est.)
note: data represent Gaza Strip and the West Bank
Median age:
total:
21.9 years
male:
21.7 years
female:
22.2 years
(2020 est.)
country comparison to the world: 181
Population growth rate:
1.77%
(2020 est.)
country comparison to the world: 57
Birth rate:
25.2 births/1,000 population
(2020 est.)
country comparison to the world: 48
Death rate:
3.4 deaths/1,000 population
(2020 est.)
country comparison to the world: 222
Net migration rate:
-4.2 migrant(s)/1,000 population
(2020 est.)
country comparison to the world: 189
Population distribution:
Palestinian settlements are primarily located in the central to western half of the territory; Jewish settlements are found in pockets throughout, particularly in the northeast, north-central, and around Jerusalem
Urbanization:
urban population:
76.7% of total population
(2020)
rate of urbanization:
3% annual rate of change
(2015-20 est.)
note: data represent Gaza Strip and the West Bank
Sex ratio:
at birth:
1.06 male(s)/female
0-14 years:
1.05 male(s)/female
15-24 years:
1.04 male(s)/female
25-54 years:
1.03 male(s)/female
55-64 years:
1.06 male(s)/female
65 years and over:
0.85 male(s)/female
total population:
1.04 male(s)/female
(2020 est.)
Maternal mortality rate:
27 deaths/100,000 live births
(2017 est.)
note: data represent Gaza Strip and the West Bank
country comparison to the world: 118
Infant mortality rate:
total:
12.8 deaths/1,000 live births
male:
14.4 deaths/1,000 live births
female:
11.1 deaths/1,000 live births
(2020 est.)
country comparison to the world: 103
Life expectancy at birth:
total population:
75.9 years
male:
73.8 years
female:
78.1 years
(2020 est.)
country comparison to the world: 109
Total fertility rate:
3.07 children born/woman
(2020 est.)
country comparison to the world: 49
Contraceptive prevalence rate:
57.2%
(2014)
note: includes Gaza Strip and the West Bank
Drinking water source:
improved:
urban:
97.1% of population
rural:
97.1% of population
total:
96.8% of population
unimproved:
urban:
2.9% of population
rural:
2.9% of population
total:
3.2% of population
(2017 est.)
note: includes Gaza Strip and the West Bank
Physicians density:
1.45 physicians/1,000 population
(2017)
Hospital bed density:
1.3 beds/1,000 population
(2018)
Sanitation facility access:
improved:
urban:
100% of population
rural:
99.3% of population
total:
99.8% of population
unimproved:
urban:
0% of population
rural:
0.7% of population
total:
0.2% of population
(2017 est.)
note: note includes Gaza Strip and the West Bank
HIV/AIDS - adult prevalence rate:
NA
HIV/AIDS - people living with HIV/AIDS:
NA
HIV/AIDS - deaths:
NA
Children under the age of 5 years underweight:
1.4%
(2014)
note: estimate is for Gaza Strip and the West Bank
country comparison to the world: 123
Education expenditures:
5.3% of GDP
(2017)
note: includes Gaza Strip and the West Bank
country comparison to the world: 48
Literacy:
definition:
age 15 and over can read and write
total population:
97.2%
male:
98.7%
female:
95.7%
(2018)
note: estimates are for Gaza and the West Bank
School life expectancy (primary to tertiary education):
total:
13 years
male:
13 years
female:
14 years
(2019)
note: data represent Gaza Strip and the West Bank
Unemployment, youth ages 15-24:
total:
42.2%
male:
37%
female:
69.4%
(2018 est.)
note: includes Gaza Strip
country comparison to the world: 9
Government
Country name:
conventional long form:
none
conventional short form:
West Bank
etymology:
name refers to the location of the region - occupied and administered by Jordan after 1948 - that fell on the far side (west bank) of the Jordan River in relation to Jordan proper; the designation was retained following the 1967 Six-Day War and the subsequent changes in government
Economy
Economic overview:
In 2017, the economic outlook in the West Bank - the larger of the two areas comprising the Palestinian Territories – remained fragile, as security concerns and political friction slowed economic growth. Unemployment in the West Bank remained high at 19.0% in the third quarter of 2017, only slightly better than 19.6% at the same point the previous year, while the labor force participation rate remained flat, year-on-year.
++ Longstanding Israeli restrictions on imports, exports, and movement of goods and people continue to disrupt labor and trade flows and the territory's industrial capacity, and constrain private sector development. The PA's budget benefited from an effort to improve tax collection, coupled with lower spending in 2017, but the PA for the foreseeable future will continue to rely heavily on donor aid for its budgetary needs and infrastructure development.
GDP real growth rate:
5.3%
(2014 est.)
1%
(2013 est.)
6%
(2012 est.)
note: excludes Gaza Strip
country comparison to the world: 42
Inflation rate (consumer prices):
0.2%
(2017 est.)
-0.2%
(2016 est.)
note: excludes Gaza Strip
country comparison to the world: 31
Credit ratings:
GDP (purchasing power parity) - real:
$21.22 billion
(2014 est.)
$20.15 billion
(2013 est.)
$19.95 billion
(2012 est.)
note: data are in 2014 US dollars; includes Gaza Strip
GDP (official exchange rate):
$9.828 billion
(2014 est.)
note: excludes Gaza Strip
GDP - per capita (PPP):
$4,300
(2014 est.)
$4,400
(2013 est.)
$4,600
(2012 est.)
note: includes Gaza Strip
country comparison to the world: 161
Gross national saving:
7.8% of GDP
(2014 est.)
9.5% of GDP
(2013 est.)
5% of GDP
(2012 est.)
note: includes Gaza Strip
country comparison to the world: 170
GDP - composition, by sector of origin:
agriculture:
2.9%
(2017 est.)
industry:
19.5%
(2017 est.)
services:
77.6%
(2017 est.)
note: excludes Gaza Strip
GDP - composition, by end use:
household consumption:
91.3%
(2017 est.)
government consumption:
26.7%
(2017 est.)
investment in fixed capital:
23%
(2017 est.)
investment in inventories:
0%
(2017 est.)
exports of goods and services:
20%
(2017 est.)
imports of goods and services:
-61%
(2017 est.)
note: excludes Gaza Strip
Ease of Doing Business Index scores:
Agriculture - products:
olives, citrus fruit, vegetables; beef, dairy products
Industries:
small-scale manufacturing, quarrying, textiles, soap, olive-wood carvings, and mother-of-pearl souvenirs
Industrial production growth rate:
2.2%
(2017 est.)
note: includes Gaza Strip
country comparison to the world: 127
Labor force:
1.24 million
(2017 est.)
note: excludes Gaza Strip
country comparison to the world: 134
Labor force - by occupation:
agriculture:
11.5%
industry:
34.4%
services:
54.1%
(2013 est.)
note: excludes Gaza Strip
Unemployment rate:
27.9%
(2017 est.)
27%
(2016 est.)
note: excludes Gaza Strip
country comparison to the world: 201
Population below poverty line:
18%
(2011 est.)
Household income or consumption by percentage share:
lowest 10%:
3.2%
highest 10%:
28.2%
(2009 est.)
note: includes Gaza Strip
Budget:
revenues:
1.314 billion
(2017 est.)
expenditures:
1.278 billion
(2017 est.)
note: includes Palestinian Authority expenditures in the Gaza Strip
Taxes and other revenues:
13.4% (of GDP)
(2017 est.)
country comparison to the world: 207
Budget surplus (+) or deficit (-):
0.4% (of GDP)
(2017 est.)
country comparison to the world: 39
Public debt:
24.4% of GDP
(2014 est.)
23.8% of GDP
(2013 est.)
country comparison to the world: 177
Fiscal year:
calendar year
Current account balance:
-$1.444 billion
(2017 est.)
-$1.348 billion
(2016 est.)
country comparison to the world: 158
Exports:
$2.126 billion
(2017 est.)
$1.827 billion
(2016 est.)
note: excludes Gaza Strip
country comparison to the world: 143
Exports - commodities:
stone, olives, fruit, vegetables, limestone
Imports:
$6.565 billion
(2017 est.)
$6.207 billion
(2016 est.)
note: data include the Gaza Strip
country comparison to the world: 127
Imports - commodities:
food, consumer goods, construction materials, petroleum, chemicals
Reserves of foreign exchange and gold:
$0
(31 December 2017 est.)
$583 million
(31 December 2015 est.)
country comparison to the world: 195
Debt - external:
$1.662 billion
(31 March 2016 est.)
$1.467 billion
(31 March 2015 est.)
note: data include the Gaza Strip
country comparison to the world: 157
Exchange rates:
new Israeli shekels (ILS) per US dollar -
3.606
(2017 est.)
3.841
(2016 est.)
3.841
(2015 est.)
3.8869
(2014 est.)
3.5779
(2013 est.)
Energy
Electricity access:
electrification - total population:
100%
(2020)
note: data for West Bank and Gaza Strip combined
Electricity - production:
1.093 billion kWh
(2016 est.)
country comparison to the world: 148
Electricity - consumption:
6.489 billion kWh
(2016 est.)
country comparison to the world: 110
Electricity - exports:
0 kWh
(2016)
country comparison to the world: 217
Electricity - imports:
5.473 billion kWh
(2016 est.)
country comparison to the world: 36
Electricity - installed generating capacity:
170,000 kW
(2016 est.)
note: includes Gaza Strip
country comparison to the world: 170
Electricity - from fossil fuels:
78% of total installed capacity
(2016 est.)
country comparison to the world: 90
Electricity - from nuclear fuels:
0% of total installed capacity
(2017 est.)
country comparison to the world: 211
Electricity - from hydroelectric plants:
0% of total installed capacity
(2017 est.)
country comparison to the world: 213
Electricity - from other renewable sources:
22% of total installed capacity
(2017 est.)
country comparison to the world: 34
Crude oil - production:
0 bbl/day
(2018 est.)
country comparison to the world: 217
Crude oil - exports:
0 bbl/day
(2015 est.)
country comparison to the world: 215
Crude oil - imports:
0 bbl/day
(2015 est.)
country comparison to the world: 215
Crude oil - proved reserves:
0 bbl
(1 January 2018)
country comparison to the world: 212
Refined petroleum products - production:
0 bbl/day
(2015 est.)
country comparison to the world: 215
Refined petroleum products - consumption:
24,000 bbl/day
(2016 est.)
country comparison to the world: 131
Refined petroleum products - exports:
19 bbl/day
(2015 est.)
country comparison to the world: 123
Refined petroleum products - imports:
22,740 bbl/day
(2015 est.)
country comparison to the world: 113
Natural gas - production:
0 cu m
(2017 est.)
country comparison to the world: 214
Natural gas - consumption:
0 cu m
(2017 est.)
country comparison to the world: 213
Natural gas - exports:
0 cu m
(2017 est.)
country comparison to the world: 212
Natural gas - imports:
0 cu m
(2017 est.)
country comparison to the world: 212
Natural gas - proved reserves:
0 cu m
(1 January 2014 est.)
country comparison to the world: 207
Carbon dioxide emissions from consumption of energy:
3.113 million Mt
(2017 est.)
country comparison to the world: 146
Communications
Telephones - fixed lines:
total subscriptions:
472,293
(includes Gaza Strip) (2017 est.)
subscriptions per 100 inhabitants:
9
(includes Gaza Strip) (2016 est.)
country comparison to the world: 93
Telephones - mobile cellular:
total subscriptions:
4,135,363
(includes Gaza Strip) (2017 est.)
subscriptions per 100 inhabitants:
76
(includes Gaza Strip)
(2017 est.)
country comparison to the world: 129
Telecommunication systems:
general assessment:
continuing political and economic instability has impeded liberalization of the telecommunications industry
(2018)
domestic:
Israeli company BEZEK and the Palestinian company PALTEL are responsible for fixed-line services; two Palestinian cellular providers, JAWWAL and WATANIYA MOBILE, launched 3G mobile networks in the West Bank in January 2018 after Israel lifted its ban; fixed-line 9 per 100 and mobile-cellular 76 per 100 (includes Gaza Strip)
(2019)
international:
country code 970 or 972; 1 international switch in Ramallah
note: the COVID-19 outbreak is negatively impacting telecommunications production and supply chains globally; consumer spending on telecom devices and services has also slowed due to the pandemic's effect on economies worldwide; overall progress towards improvements in all facets of the telecom industry - mobile, fixed-line, broadband, submarine cable and satellite - has moderated
Broadcast media:
the Palestinian Authority operates 1 TV and 1 radio station; about 20 private TV and 40 radio stations; both Jordanian TV and satellite TV are accessible
Internet country code:
.psnote - same as Gaza Strip
Internet users:
total:
2.673 million
(includes Gaza Strip)
percent of population:
57.4%
(July 2016 est.)
country comparison to the world: 106
Broadband - fixed subscriptions:
total:
371,299
subscriptions per 100 inhabitants:
14
(2017 est.)
note: includes Gaza Strip
country comparison to the world: 93
Transportation
Airports:
2
(2013)
country comparison to the world: 208
Airports - with paved runways:
total:
2
(2013)
1,524 to 2,437 m:
1
(2013)
under 914 m:
1
(2013)
Heliports:
1
(2013)
Roadways:
total:
4,686 km
(2010)
paved:
4,686 km
(2010)
note: includes Gaza Strip
country comparison to the world: 149
Military and Security
Military and security forces:
per the Oslo Accords, the PA is not permitted a conventional military but maintains security and police forces; PA security personnel have operated almost exclusively in the West Bank since HAMAS seized power in the Gaza Strip in 2007; PA forces include National Security Forces, Presidential Guard, Civil Police, Civil Defense, Preventative Security Organization, the General Intelligence Organization, and the Military Intelligence Organization
(2020)
Military and security service personnel strengths:
the Palestinian Authority Security Forces have approximately 30,000 active personnel
(2019 est.)
Military equipment inventories and acquisitions:
the Palestinian Authority Security Forces are armed mostly with small arms and light weapons, although since 2007, they have received limited amounts of heavier equipment from Jordan (armored personnel carriers) and Russia (armored personnel carriers and transport helicopters)
(2019 est.)
Terrorism
Terrorist group(s):
Al-Aqsa Martyrs Brigade; HAMAS; Islamic Revolutionary Guard Corps/Qods Force; Kahane Chai; Palestine Islamic Jihad; Palestine Liberation Front; Popular Front for the Liberation of Palestine
(2019)
note: details about the history, aims, leadership, organization, areas of operation, tactics, targets, weapons, size, and sources of support of the group(s) appear(s) in Appendix-T
Transnational Issues
Disputes - international:
the current status of the West Bank is subject to the Israeli-Palestinian Interim Agreement - permanent status to be determined through further negotiation; Israel continues construction of a "seam line" separation barrier along parts of the Green Line and within the West Bank; Israel withdrew from Gaza and four settlements in the northern West Bank in August 2005; since 1948, about 350 peacekeepers from the UN Truce Supervision Organization (UNTSO), headquartered in Jerusalem, monitor ceasefires, supervise armistice agreements, prevent isolated incidents from escalating, and assist other UN personnel in the region
Refugees and internally displaced persons:
refugees (country of origin):
858,758 (Palestinian refugees) (2020)
IDPs:
243,000 (includes persons displaced within the Gaza strip due to the intensification of the Israeli-Palestinian conflict since June 2014 and other Palestinian IDPs in the Gaza Strip and West Bank who fled as long ago as 1967, although confirmed cumulative data do not go back beyond 2006) (2019)